Gauge Chart
A gauge with a dial. All options can be found in the Google documentation. Gauge charts are useful when you want to measure how values are performing against specific reference numbers. For example, we at Lively Apps use Gauge charts in our Confluence to visualize the success factors of our software projects. Very useful!
Expected InputFormat
The input data for Gauge charts need to be a table with 2 columns:
Column 1: Label that will be displayed in the middle of the chart
Column 2: Value that will be pointed at by the needle
If the dataset contains multiple rows, multiple Gauge charts will be displayed. The first row, the table headers, are ignored.
Coloring And Configuration Ticks
This Gauge has colored areas and labeled ticks.
CODE
<script>
PocketQuery.chart('Gauge', {
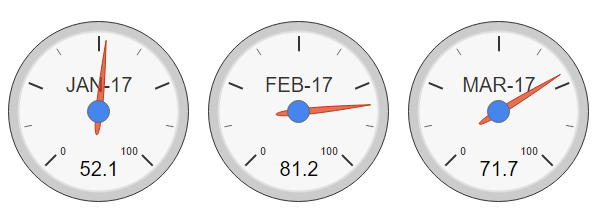
dataTable: [['Month', 'Value'], // adding dummy data for testing; remove this attribute for productive use
['JAN-17', 52.1],
['FEB-17', 81.2],
['MAR-17', 71.7]],
width: 600, // setting size of resulting area that includes ALL charts drawn
height: 350,
max: 100, // setting max value (highly depends on data to be displayed)
majorTicks: ['0%','20%','40%','60%','80%','100%'], // setting labels of the major ticks; they will be distributed evenly
minorTicks: 4,
greenFrom: 45, // setting range of green area
greenTo: 75,
yellowFrom: 75, // setting range of yellow area
yellowTo: 95,
redFrom: 95, // setting range of red area
redTo: 100
});
</script>