Simple Bar Chart
Using all defaults, the chart can be drawn by only a few lines of code:
CODE
<script>
PocketQuery.chart('BarChart');
</script>
This example implicitly uses our dummy data. If you want to reproduce exactly the result above, you need to add the dummy data:
CODE
<script>
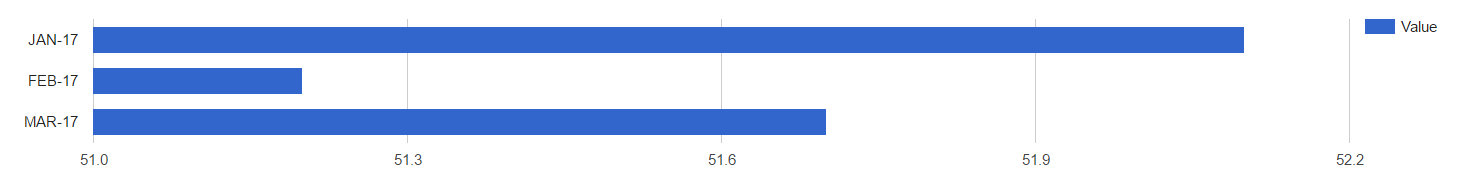
PocketQuery.chart('BarChart', {
dataTable: [['Month', 'Value'], // adding dummy data for testing; remove this attribute for productive use
['JAN-17', 52.1],
['FEB-17', 51.2],
['MAR-17', 51.7]]
});
</script>