This template code changes the bar's color, adds a meaningful title and removes the legend.
<script>
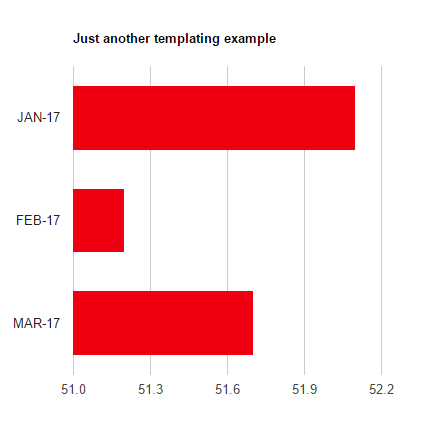
PocketQuery.chart('BarChart', {
dataTable: [['Month', 'Value'], // adding dummy data for testing; remove this attribute for productive use
['JAN-17', 52.1],
['FEB-17', 51.2],
['MAR-17', 51.7]],
title: "Just another templating example",
width: 500,
height: 500,
legend: {position: 'none'}, // do not show legend
colors: ['#ee0011']
});
</script>