Expected Input Format
The PieChart expects the data to be structured in two columns:
-
Column: Labels of the sections
-
Column: Values of the sections (must be numeric)
The first row, the table headers, are ignored.
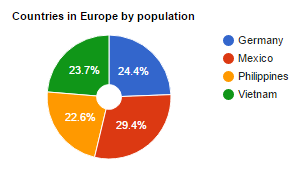
Adjusting Title and Pie Hole
<script>
PocketQuery.chart('PieChart', {
    title: 'Countries in Europe by population',
    pieHole: 0.2
});
</script>
The result for the same query is this: