Column Charts
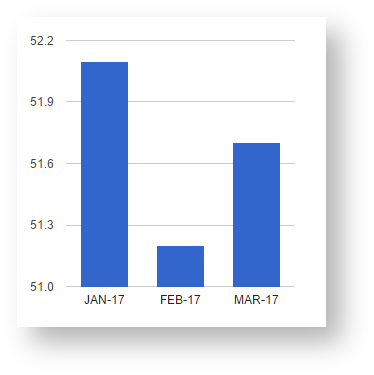
The column chart is the vertical equivalent to the bar chart. It comes with quite similar options. All options can be found in the Google Documentation.
Expected Input Format
The Column chart expects the data to be structured in two columns:
Column: Labels of the bars
Column: Values of the bars (must be numeric)
The first row, the table headers, are ignored.