Available Metrics
These are all metrics that are available in Usage Statistics for Confluence at the moment. If you have an idea for a metric that you can’t find here, let us know!
Metric Name | Description | Screenshot |
|---|---|---|
Content Growth | Displays the number of Pages, Blogs, Attachments and Space Watchers. | 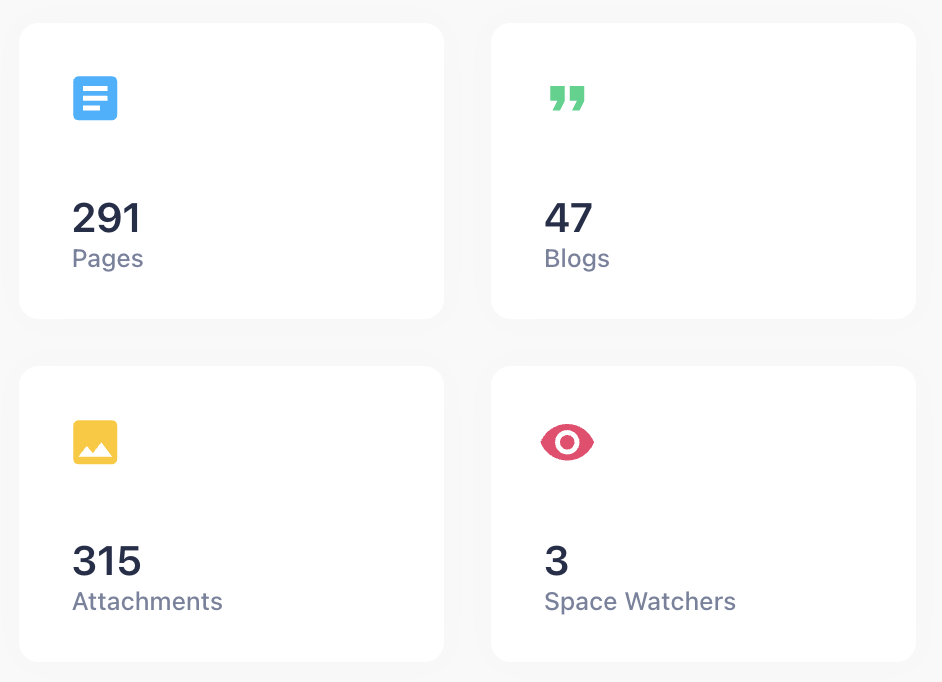 |
Daily Activity | Displays the number of created or updated pages, blogs, comments and attachments on each day for the last six months. Tip: Click on a specific day for details. | 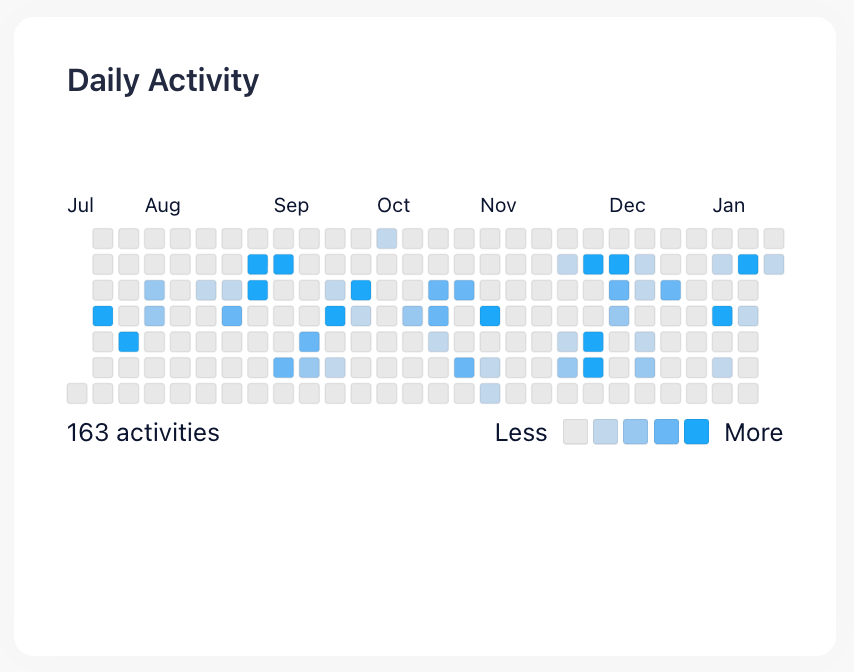 |
Top Contributors | Displays the five users that were the most involved in the creation and modification of pages and blogs in the current space. | 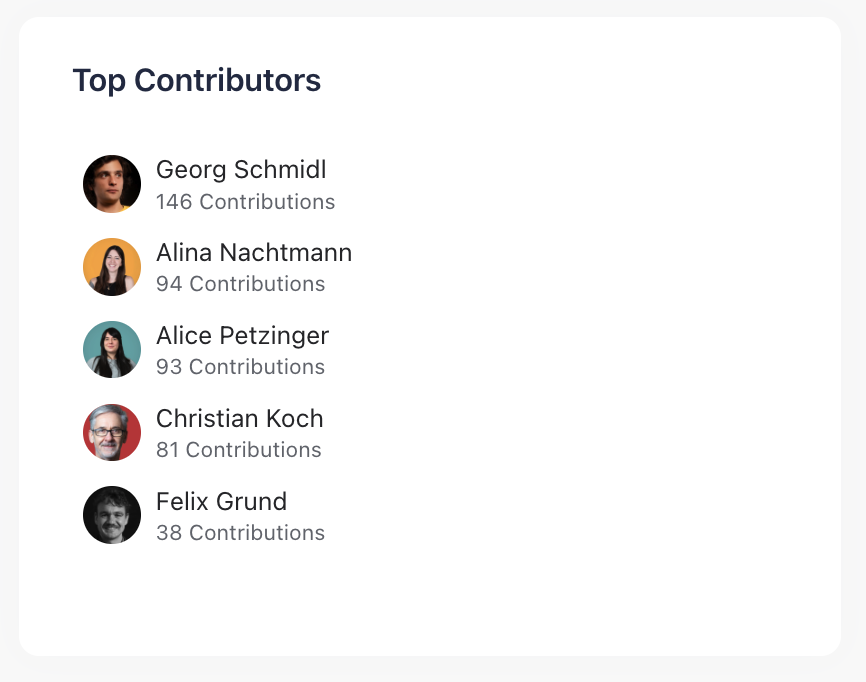 |
Content Growth Trend | Displays the overall content of pages and blogs aggregated over the last six months. This allows you to see how fast your space has grown. Tip: Hover your mouse over the graph to see more details. | 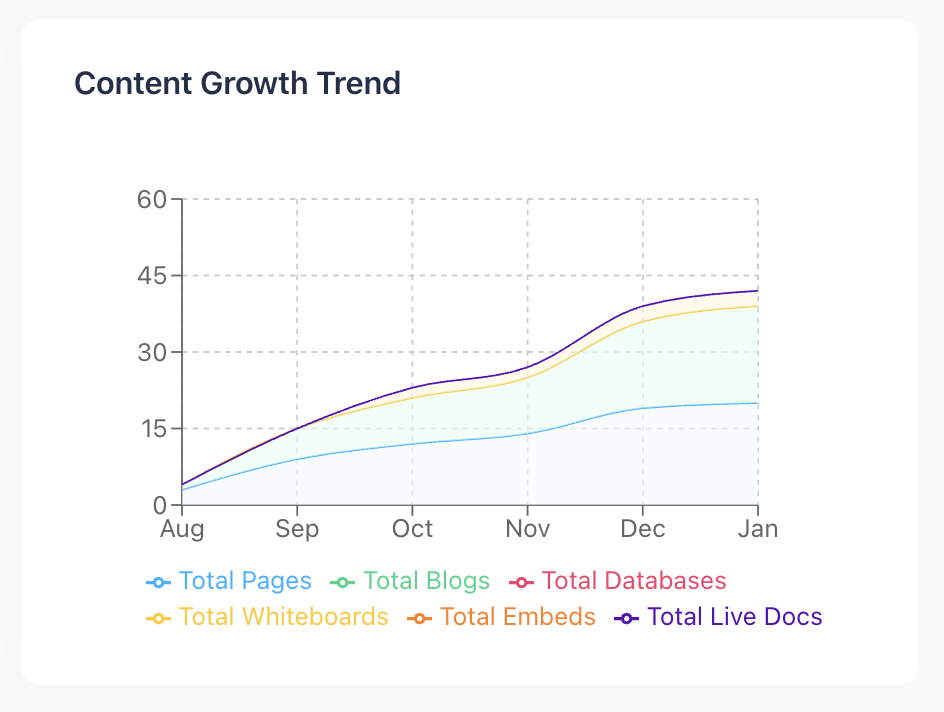 |
New Content Created | Displays a bar chart. This chart shows the number of blogs and pages created each month. Tip: Hover your mouse over the graph to see more details. | 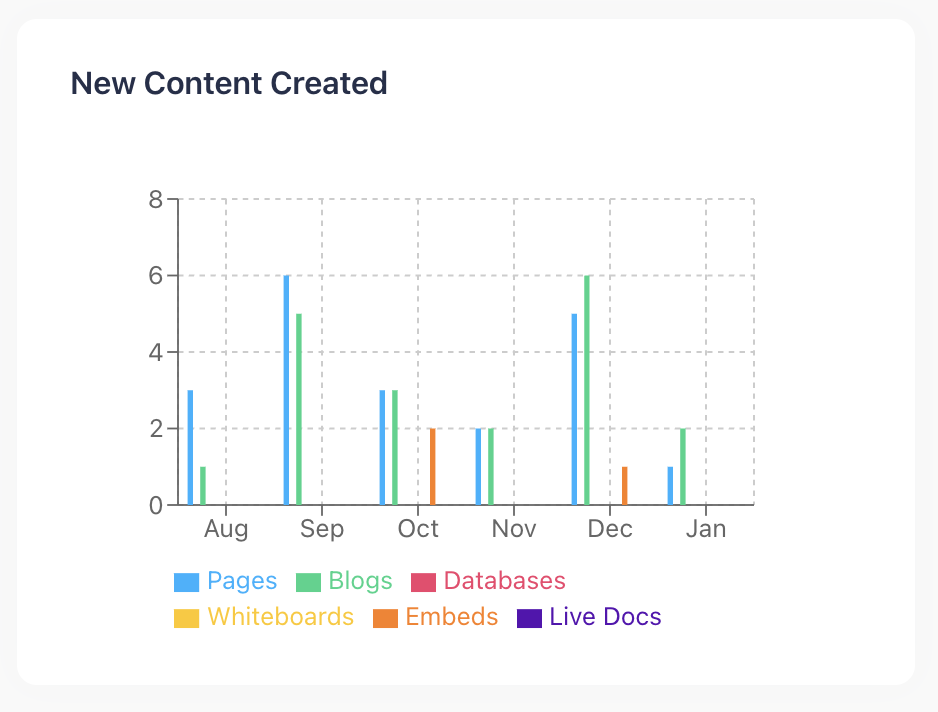 |
Popular Content | Displays the pages and blogs with the highest number of likes in the selected Confluence spaces. | 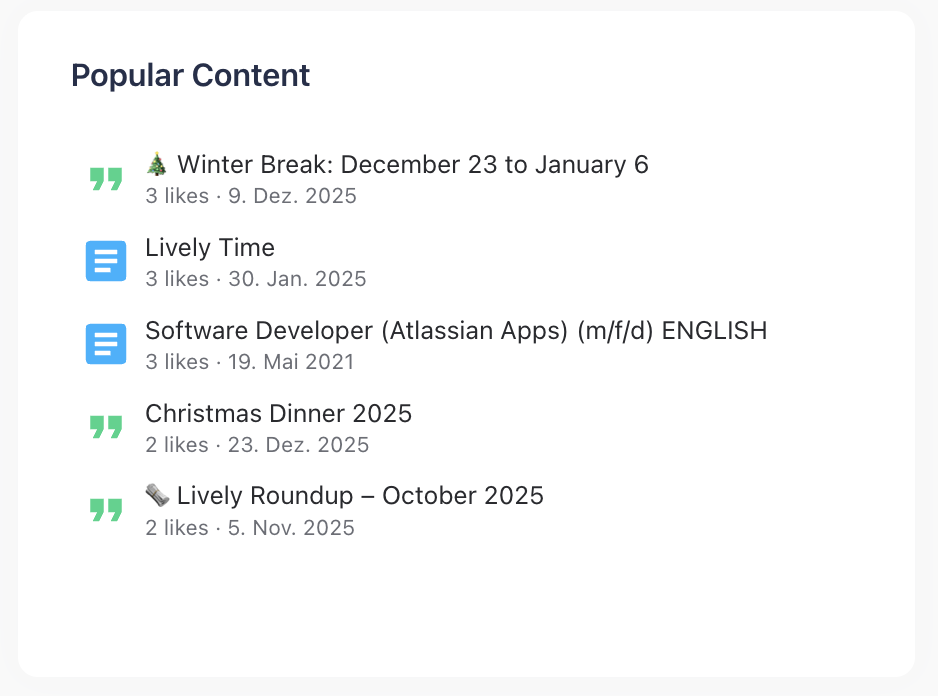 |
Active Content | Displays the pages and blogs with the highest number of edits in the selected Confluence spaces. | 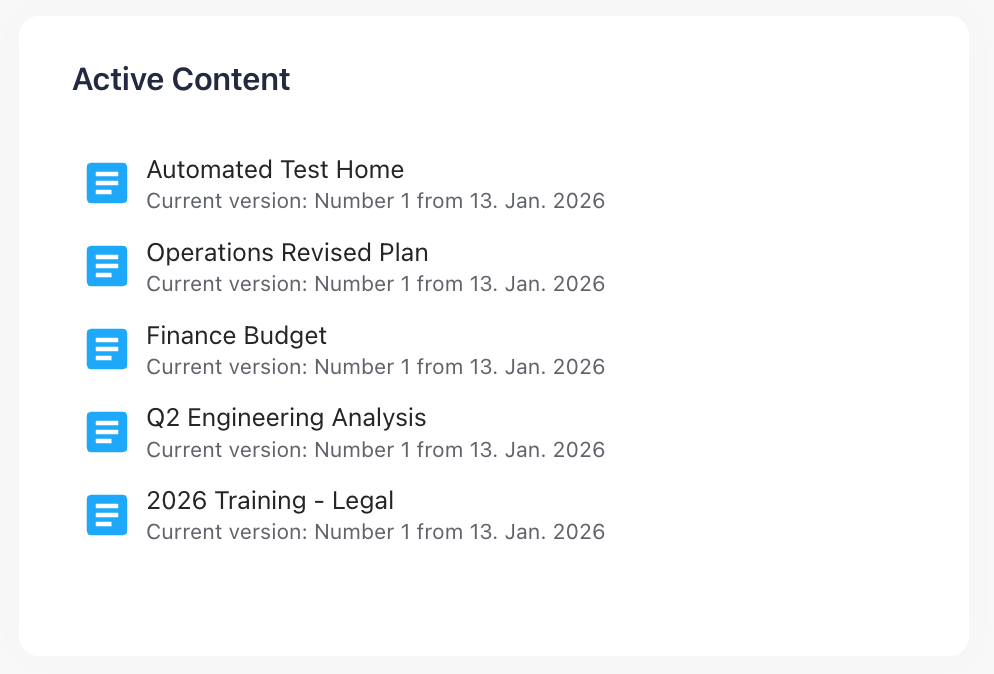 |
Latest Page Updates | Displays the five pages that were last edited in the current Confluence space. | 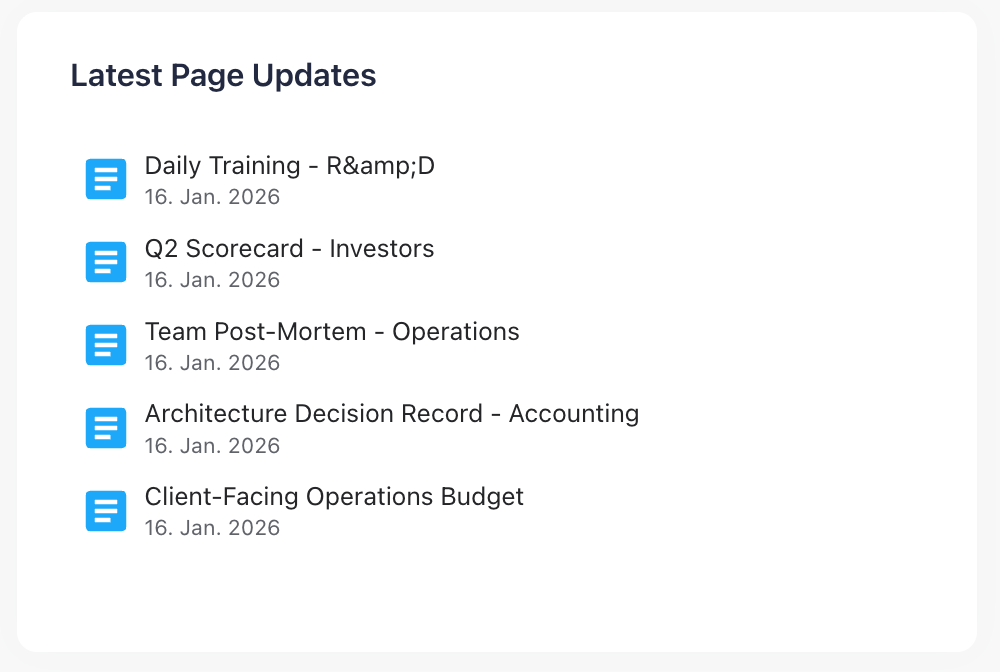 |
Least Updated Pages | Displays the five pages that haven’t been edited for the longest time in the current Confluence space. | 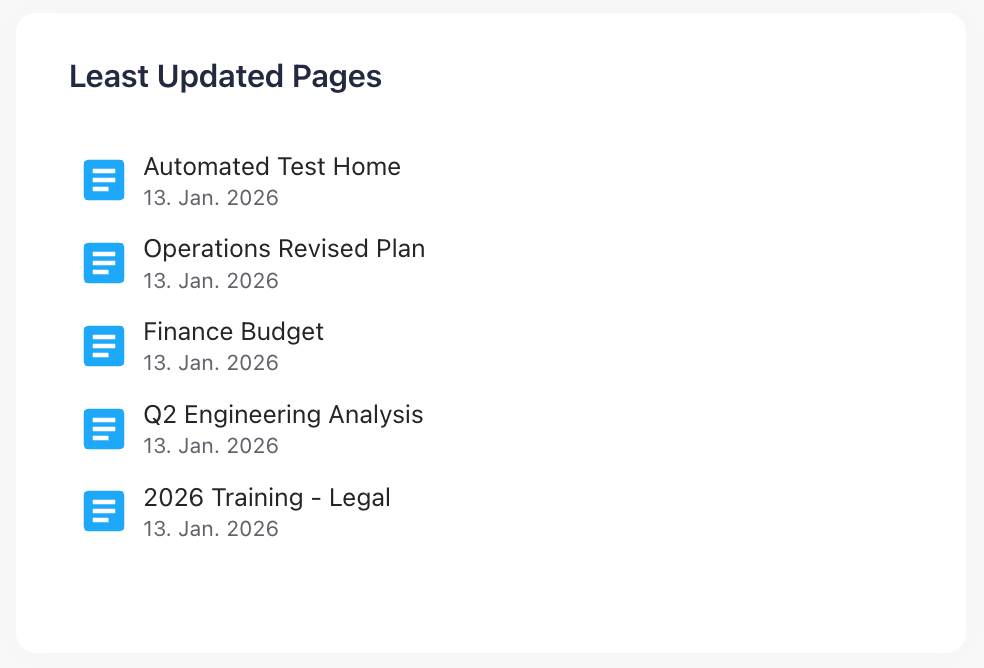 |
Attachment Types | Displays a pie chart, showing the distribution of attachment types in the current space. Tip: Hover your mouse over the graph to see more details. | 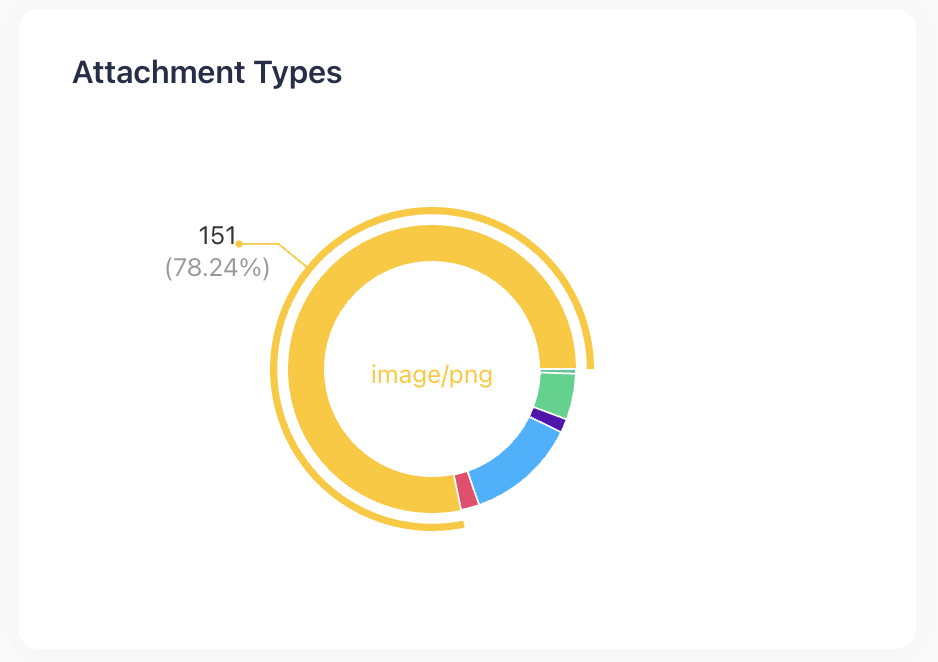 |
Largest Attachments | Displays the five biggest attachments in the current space. Note: This metric can only display the size of the current attachment version. You might have old attachment versions in your space that are different sizes from what this metric can display. | 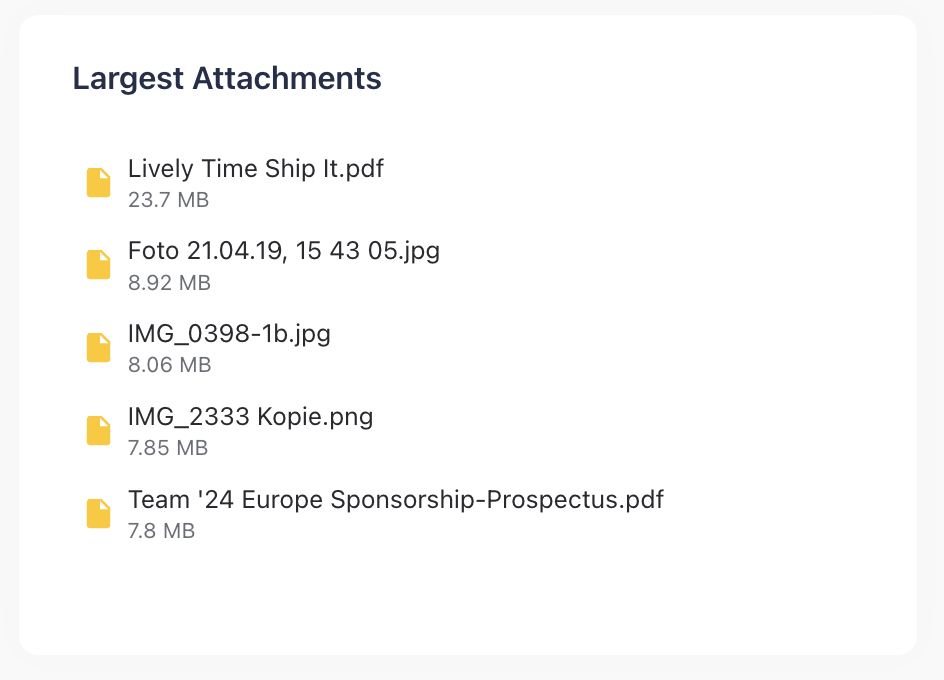 |
New Tasks | Displays the most recently created tasks filtered by the selected Confluence spaces. |  |
Resolved Tasks | Displays the most recently resolved tasks filtered by the selected Confluence spaces. | 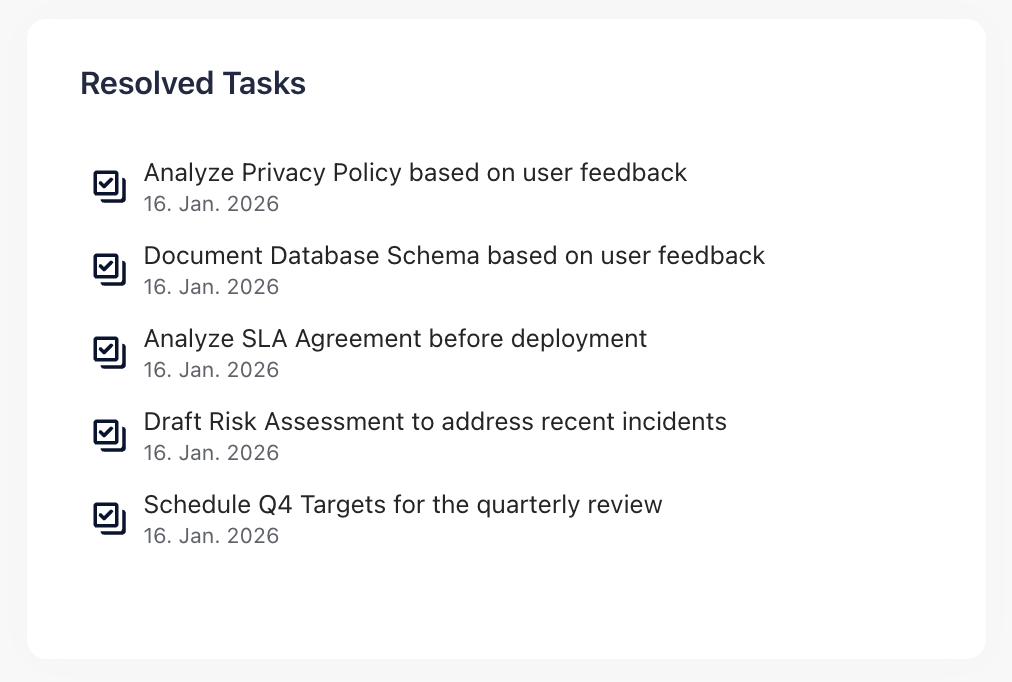 |
Latest Comments | Displays an excerpt of the five latest comments in the current Confluence space, when they were created, by whom, and on what page. | 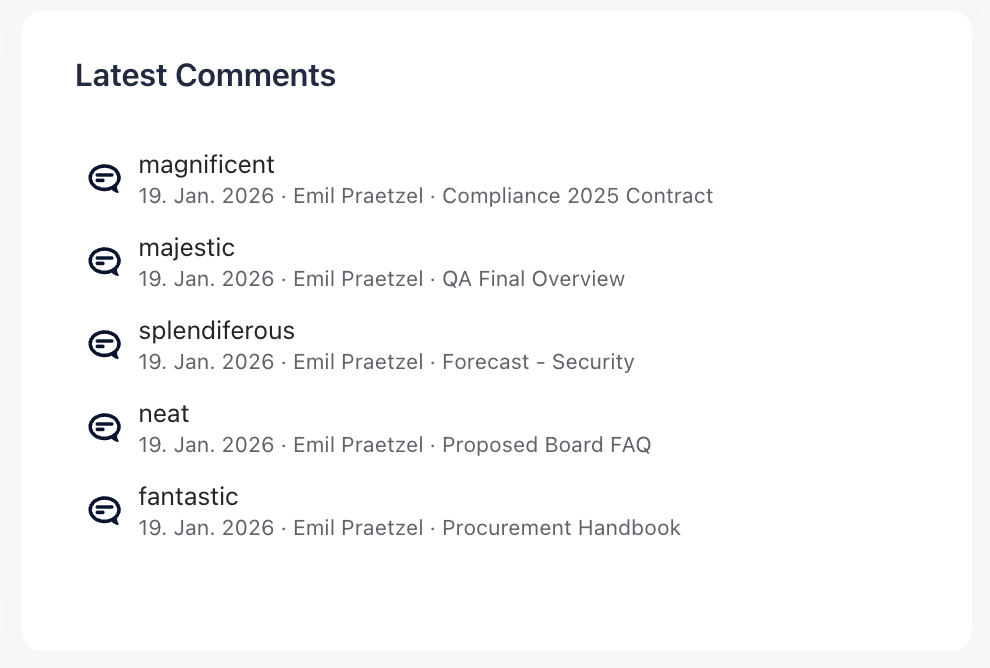 |
Top Labels | Displays the most frequently used labels on pages and blogs in the selected Confluence spaces. Labels of attachments are not considered. | 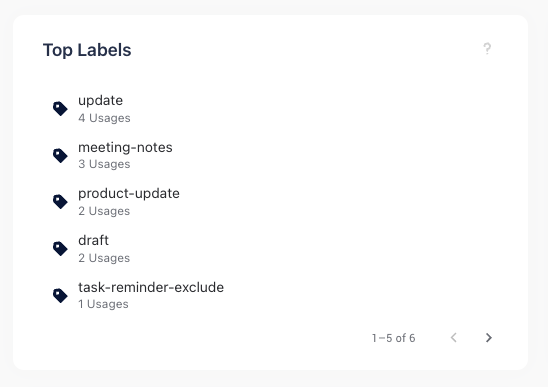 |
New Databases | Displays the most recently created databases filtered by the selected Confluence spaces. | 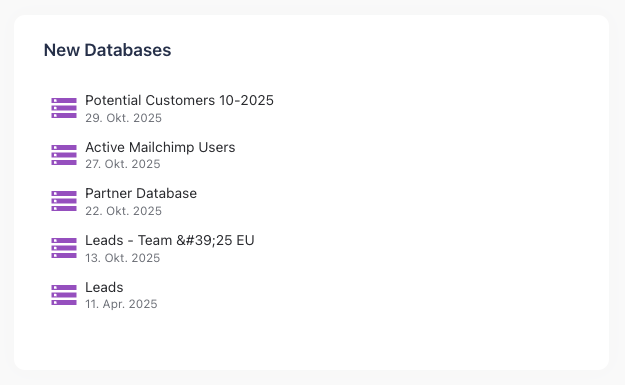 |
New Whiteboards | Displays the most recently created whiteboards filtered by the selected Confluence spaces. | 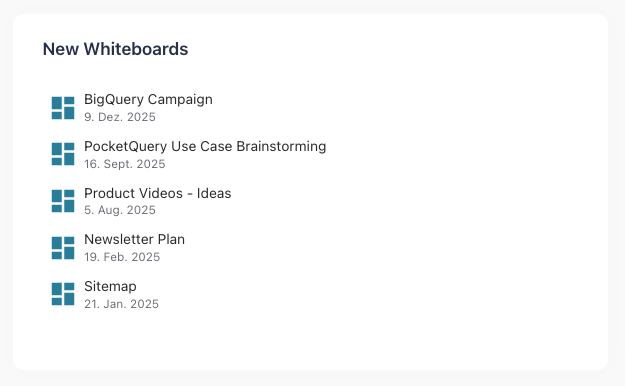 |
New Embeds | Displays the most recently created embeds filtered by the selected Confluence spaces. |  |
New Live Docs | Displays the most recently created live docs filtered by the selected Confluence spaces. | 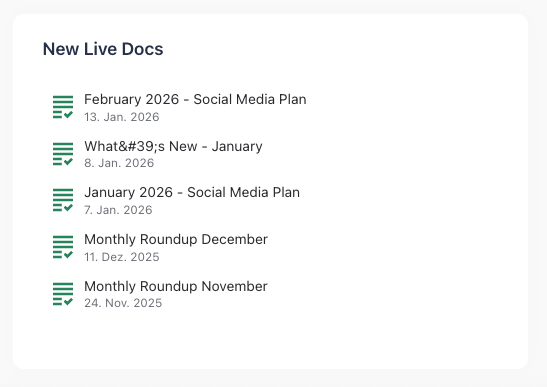 |
