It is possible to customize the status a JIRA issue passes through, but they are always assigned one out of three status categories. JIRA has no easy solution to report how many issues are currently in a state associated with the category "To Do", "In Progress" or "Done", so if you have a complex workflow it might be tricky to get the big picture. Many of our customers struggle with this. With PocketQuery for Confluence it is easy to post-process results from the Jira REST API and display the result in a Confluence page.
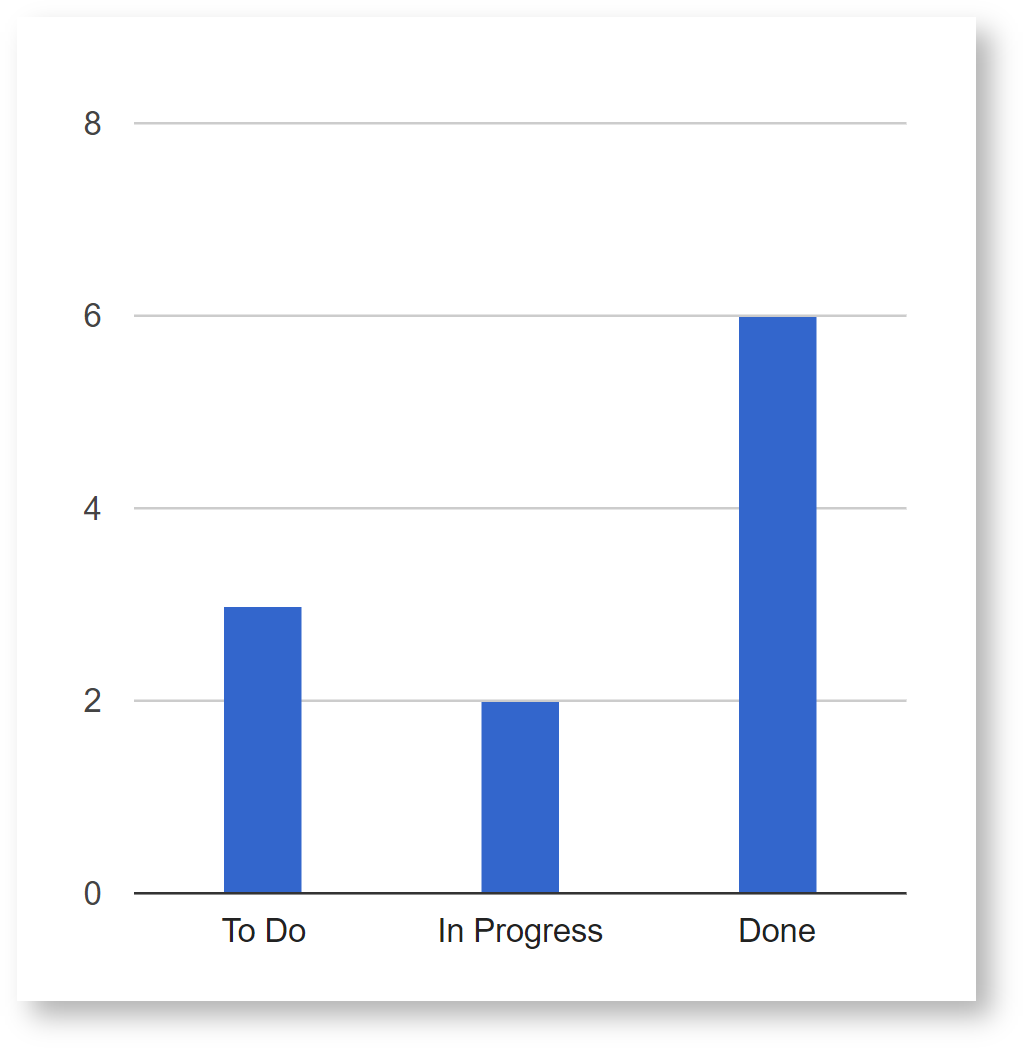
Most of the work (e.g. grouping by status category) will be done within the Converter, while we will be using a basic JQL query to retrieve all issues of a project. The result in the Confluence page will look like this:
Datasource
|
Datasource type |
REST Application Link |
|---|---|
|
Application Link |
Your Company Jira |
|
Datasource Test URL |
/rest/api/2/search |
Query
Fetches issues for a given Jira project.
|
Query URL |
|
|---|
Converter
Groups the Jira issues that were returned from the Query by category.
function convert(json) {
    const issues = JSON.parse(json).issues; // parse json string
    const categories = {};

    // iterate through issues and count occurrences of categories
    for (let issue of issues) {   // iterate over all issues
        let category = issue.fields.status.statusCategory;
        if (categories[category.name]) { // category is already listed, increase counter
            categories[category.name]++;
        } else { // category is new, add it to our collection
            categories[category.name] = 1;
        }
    }

    // build simple result for template
    const result = [];
    for (let categoryName in categories) {
        result.push({
            'Category': categoryName,
            'Number of Issues': categories[categoryName]
        });
    }

    result.sort(function(a,b) {
        return a.Category < b.Category ? 1 : -1;
    });

    return result;
}
Template
Renders the converted Query result as a chart.
<script>
  PocketQuery.chart('ColumnChart', {
    width: 500,
    height: 500,
    bar: {groupWidth: "30%"},
    legend: {position: 'none'}
  });
</script>