Column Chart With Color, Resizing and Rebasing
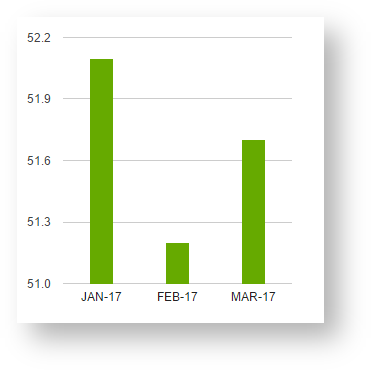
This column chart colors the bars green, makes them more slim, hides the legend and offers a way to let all bars start from value 0.
CODE
<script>
PocketQuery.chart('ColumnChart', {
dataTable: [['Month', 'Value'], // adding dummy data for testing; remove this attribute for productive use
['JAN-17', 52.1],
['FEB-17', 51.2],
['MAR-17', 51.7]],
width: 370, // setting the size
height: 400,
colors: ['#66AA00'], // changing color of bars
bar: {groupWidth: "30%"}, // making bars more slim
legend: {position: 'none'}, // do not show legend
showTip: true, // show tooltip
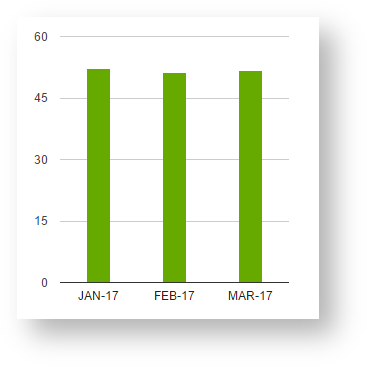
// following option is set for above example on the right
vAxis: {viewWindow: {min:0}} // start drawing bars from value 0
});
</script>