Geo Chart
Expected Input Format
The GeoChart expects the data to be structured in two columns:
Column: Country, region or continent
Column: Values
The first row, the table headers, are ignored
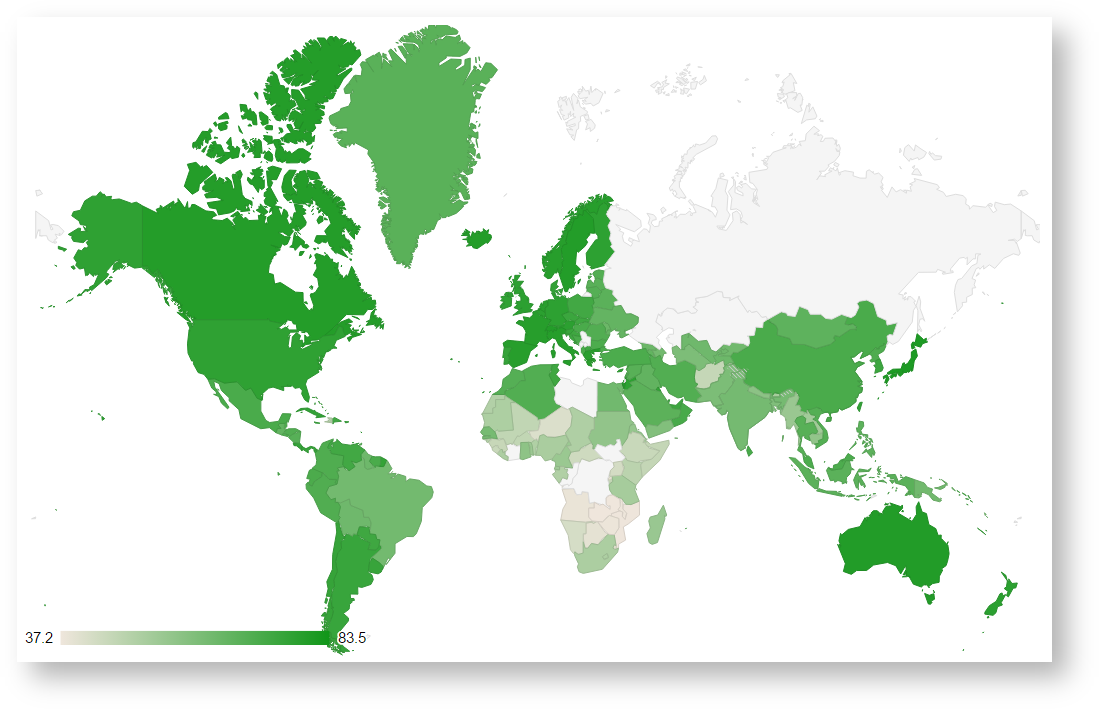
Basic Geo Chart
CODE
<script>
    PocketQuery.chart('GeoChart');
</script>
Custom Color
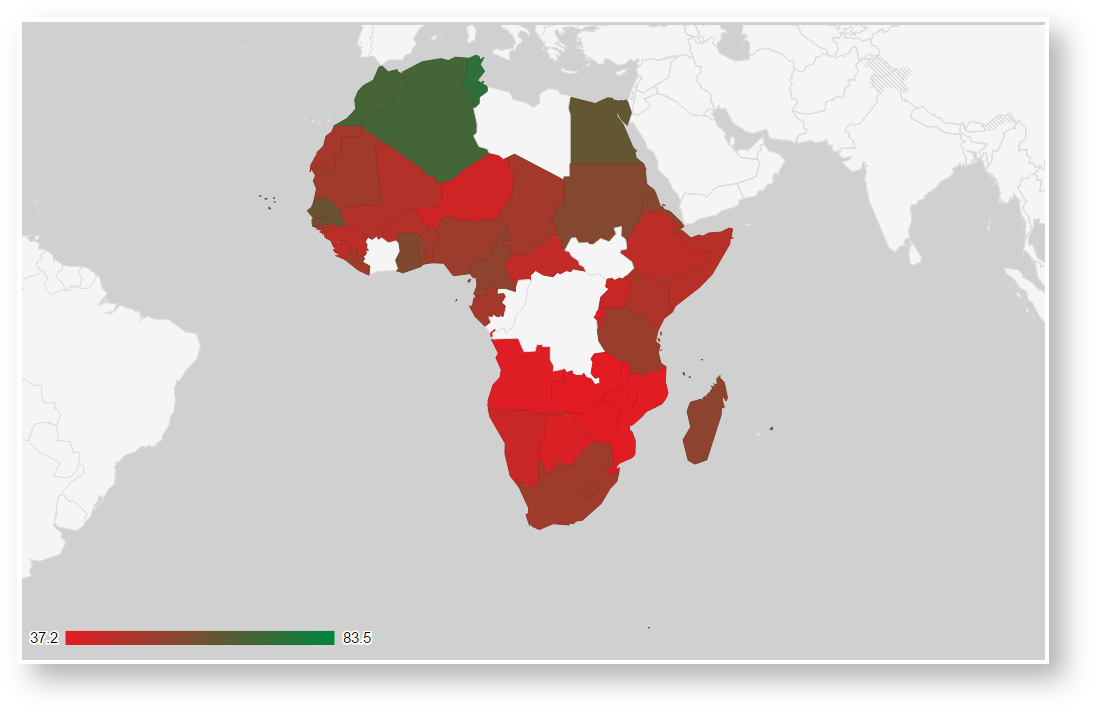
As always, you can use any configuration options you can use in Google Charts - find the options on the Google Charts manual pages. Simply pass an options object to the PocketQuery.chart() call like this and e.g. focus on Africa and change the coloring:
CODE
<script>
PocketQuery.chart('GeoChart', {
  region: '002',   // Africa
  colorAxis: {colors: ['#e31b23', '#00853f']},
  backgroundColor: '#d0d0d0'
});
</script>