The more spaces you have in Confluence, the harder it can be to keep track of what’s happening. Having a quick overview of space activity helps you stay organized and ensures your content stays relevant.
-
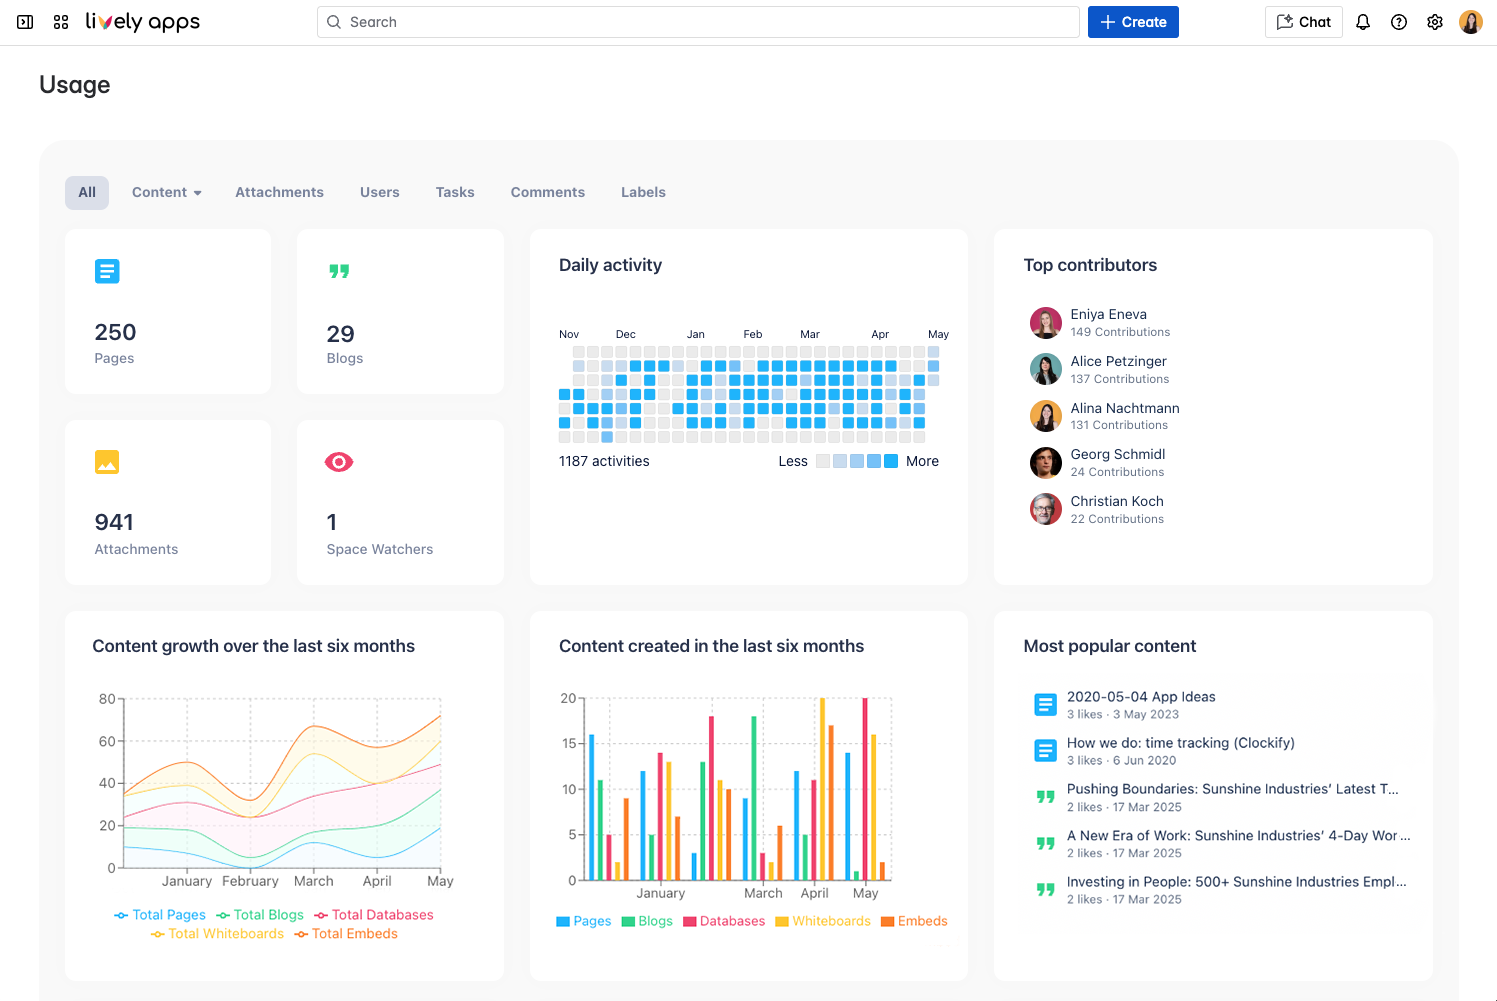
Who contributed the most to this space?
-
How many pages, blogs, and attachments are there?
-
Which labels are used the most?
-
Are there pages that haven’t been updated in a long time?
With Usage Statistics for Confluence, you get answers to these questions (and more) in a clear, easy-to-read dashboard.
Want instant insights on any Confluence page? The customizable Usage Statistics macro lets you:
-
Add real-time analytics to any page
-
Choose the metrics that matter most
-
Track daily activity and engagement trends
Want to learn more about Usage Statistics? Check out our Getting Started guide! Interested in learning more details about what metrics there are and how they can be used? Check out our Available Metrics.
Useful links
-
Our Service Desk is the best way to reach us if you have problems or would like to suggest a new feature.
-
Contact us by email via support@livelyapps.com.
-
Have a look at our other apps and discover more helpful tools