This is the last part of the Getting Started Guide! In the previous steps you have learnt know how to connect and query both SQL databases and REST APIs. You also have seen how to customize the appearance of your result via a custom Template. But now we’re going to have a look at the most powerful way to represent data: C H A R T S ! 📉 📈 📊
We’re going to modify the REST Countries example from the previous step for this. Go ahead and create a new Converter. In our chart, we want to nicely present the 10 most populated countries. So let’s go ahead, and transform, sort, and limit our result to get the data we need.
function convert(json) {
  // transform
  const countries = JSON.parse(json).map(country => {
	return {
	  'Name': country.name.official,
	  'Population': country.population
	}
  });

  // sort
  const sorted = countries.sort((a, b) => {
	return b.Population - a.Population;
  });

  // limit
  return sorted.splice(0, 10);
}
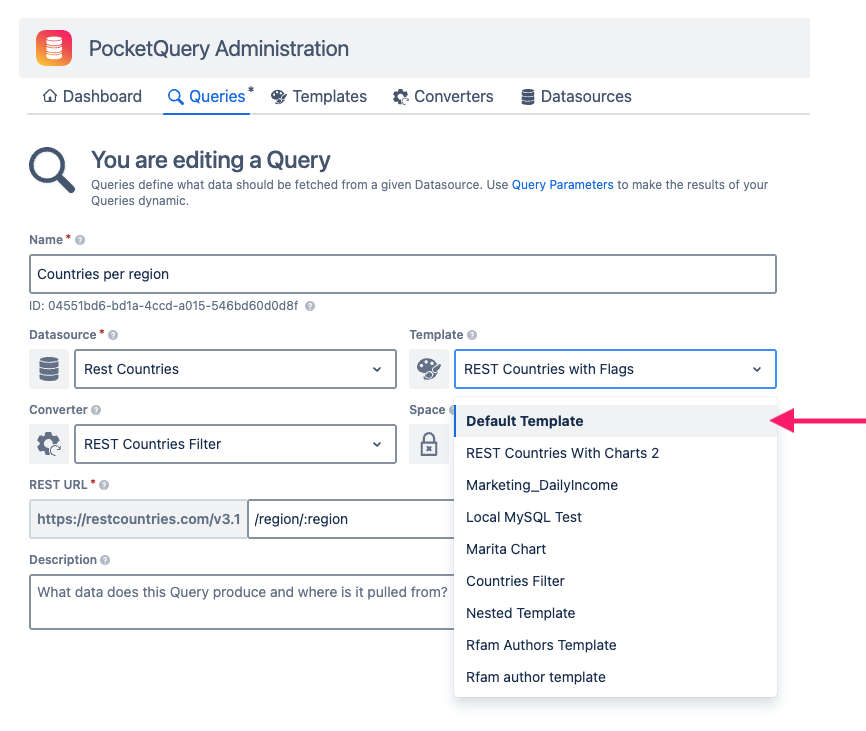
Give this new Converter a fancy name (for example Top 10 Populated Countries), save it, and apply it to your REST Countries Query. The old “REST Countries with Flags” Template won’t work well together with the new Converter anymore, so go ahead and replace it with the Default Template:
Nice! Save your Query, and head back to your Confluence page. Let the Query execute, and you should see a simple table like this:
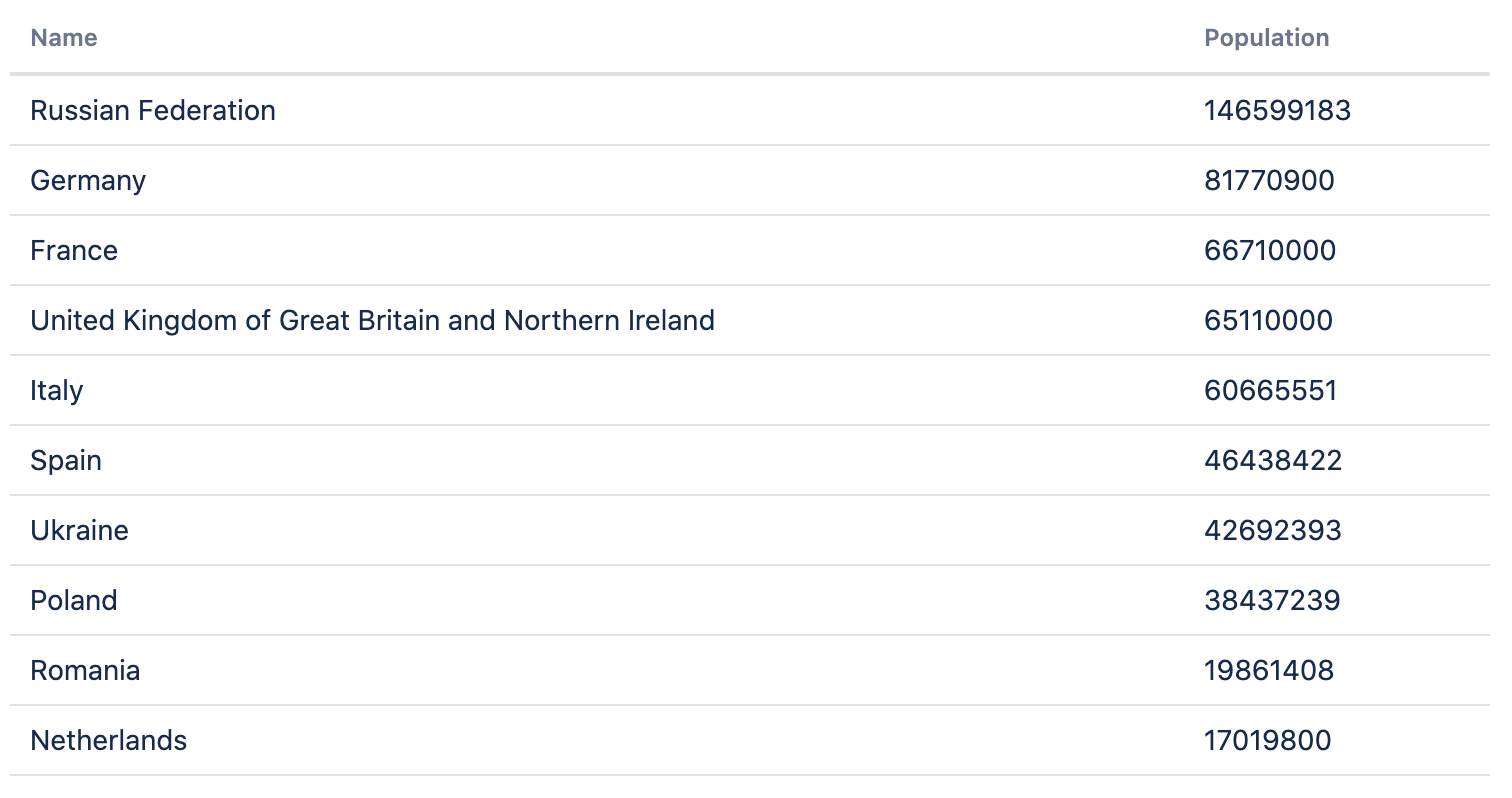
Perfect! This is exactly what our data needs to look like, if we want to turn it into a chart. So let’s go ahead and create a new Template. Name it something like “Countries Chart“ and insert this as the content:
<script>
  PocketQuery.chart("ColumnChart");
</script>
That’s it! That’s all what’s needed to render a “ColumnChart”. Apply the new Template to your Query, and head back to your page to see the result:
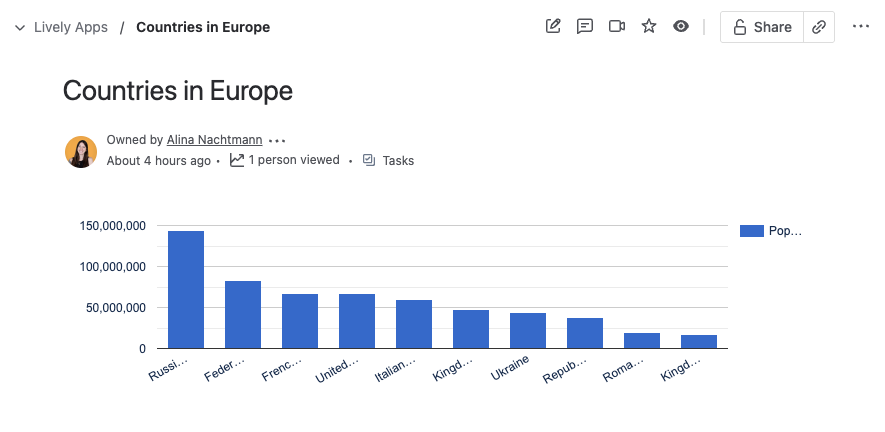
Hmmmmm… This does look like a chart, but something’s wrong. See how some of the columns have their names cut off? Looks like we need to display a different kind of chart to see everything. Luckily, PocketQuery uses Google Charts under the hood, which provides us with many charts to choose from, and lots of options for customization. Let’s try improving our chart by adding some options that we found in the BarChart documentation:
<script>
	PocketQuery.chart("Bar", {
		title: "Top 10 Most Populated Countries",
		height: 500,
		width: 1000,
		bars: "horizontal",
		colors: ["red"]
	});
</script>
Applying the above Template, this is what we get in our page:
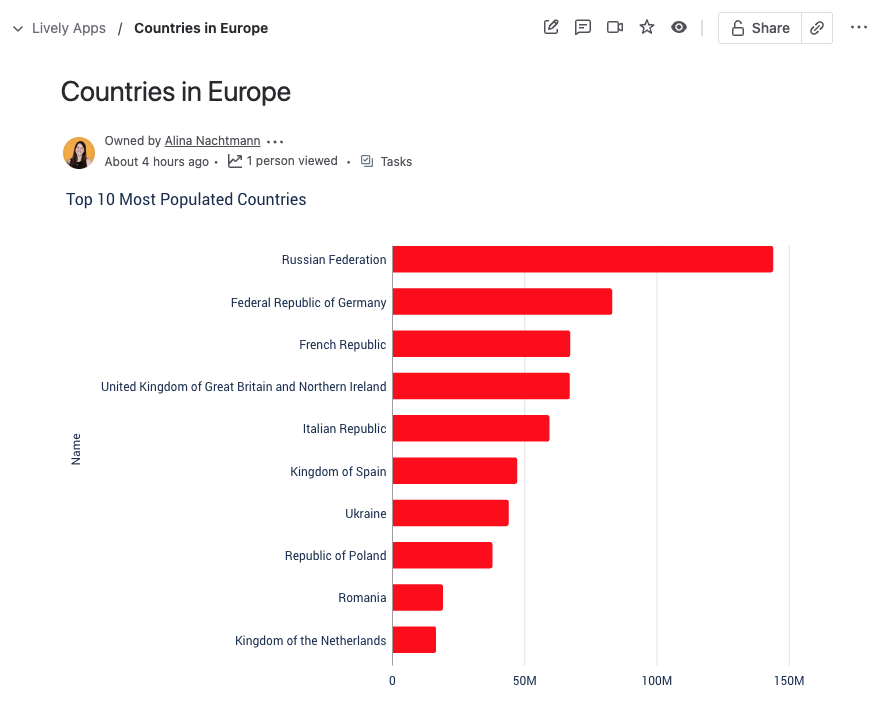
Much better! We can even see the full name of “United Kingdom of Great Britain and Northern Ireland“ now! Of course, this is just the simplest type of chart there is and there’s much more to explore out there. If you’re interested in learning more about this, we recommend looking at the PocketQuery Chart API documentation.
🥳
Congratulations! You have reached the end of the Getting Started Guide. If you want to see what else is possible with PocketQuery and learn more, we recommend completing our other https://lively-apps.atlassian.net/wiki/spaces/PQCCLDDOC/pages/905805897 and familiarizing yourself with PocketQuery's APIs. Additionally, you can browse our Example Queries & Use Cases.